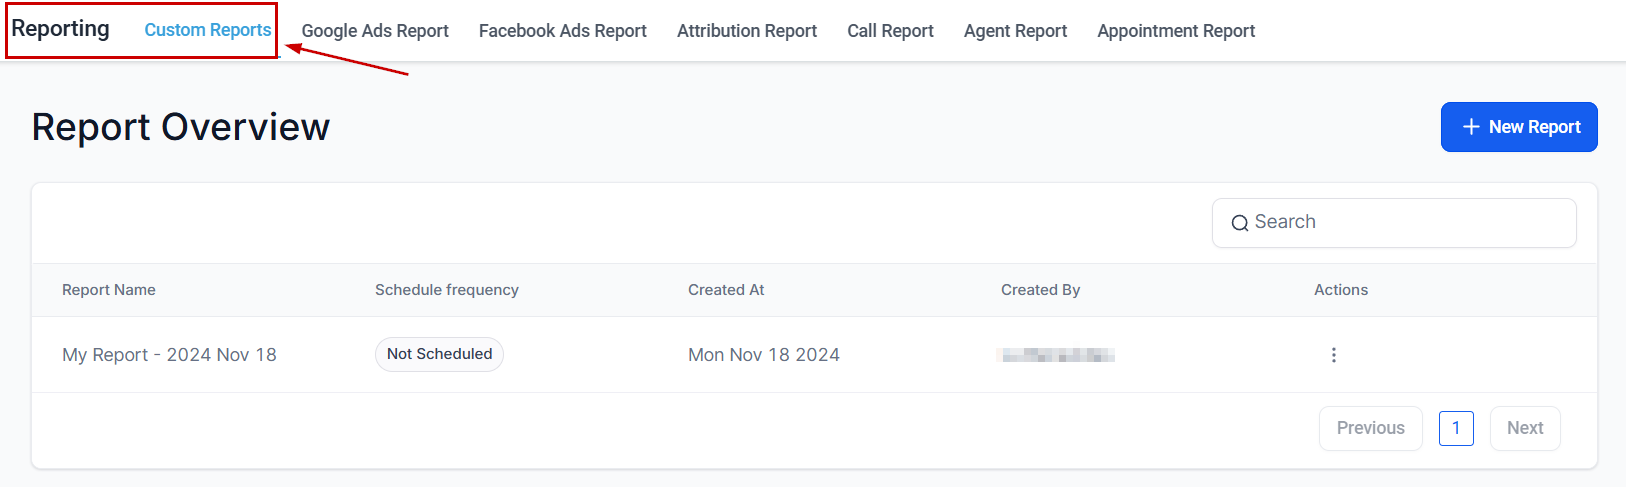
Reports allow you to provide concise and dynamic information about your company’s health. When handling your data inside the CRM, you want an easy way to relay this information to your intended audience, so let's learn how to create reports within the Reporting section.
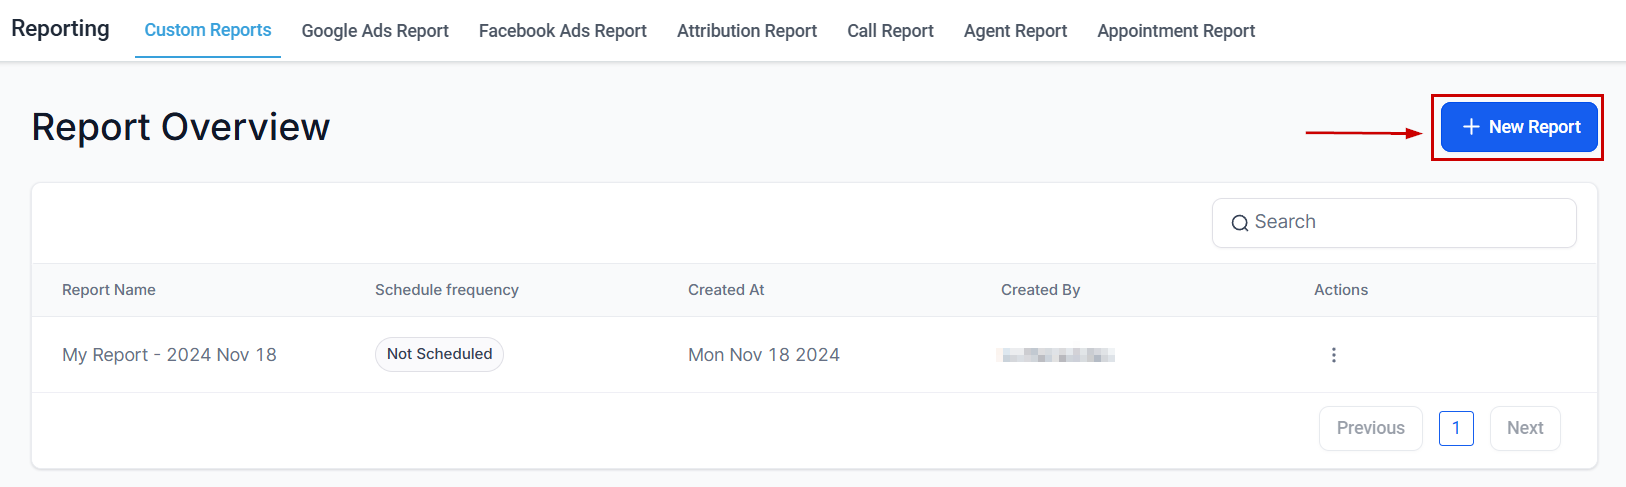
To start, click +New Report. This will open a pop-up to start the Report setup.
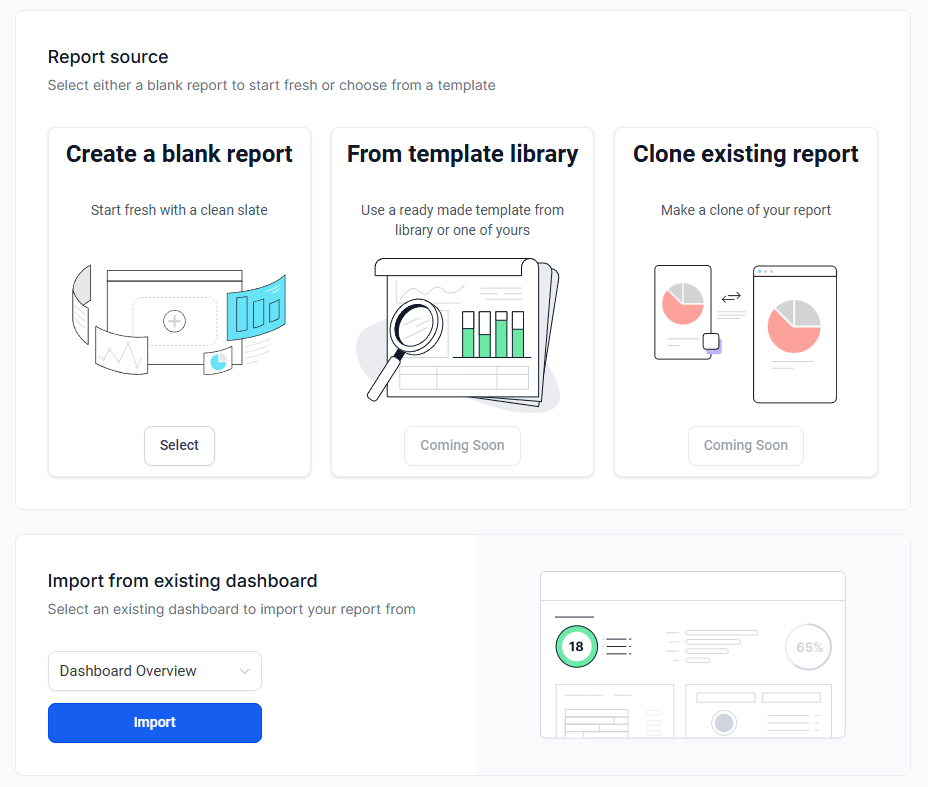
Create your report from scratch or select a Dashboard to use as a template for the information.
Creating a Blank Report
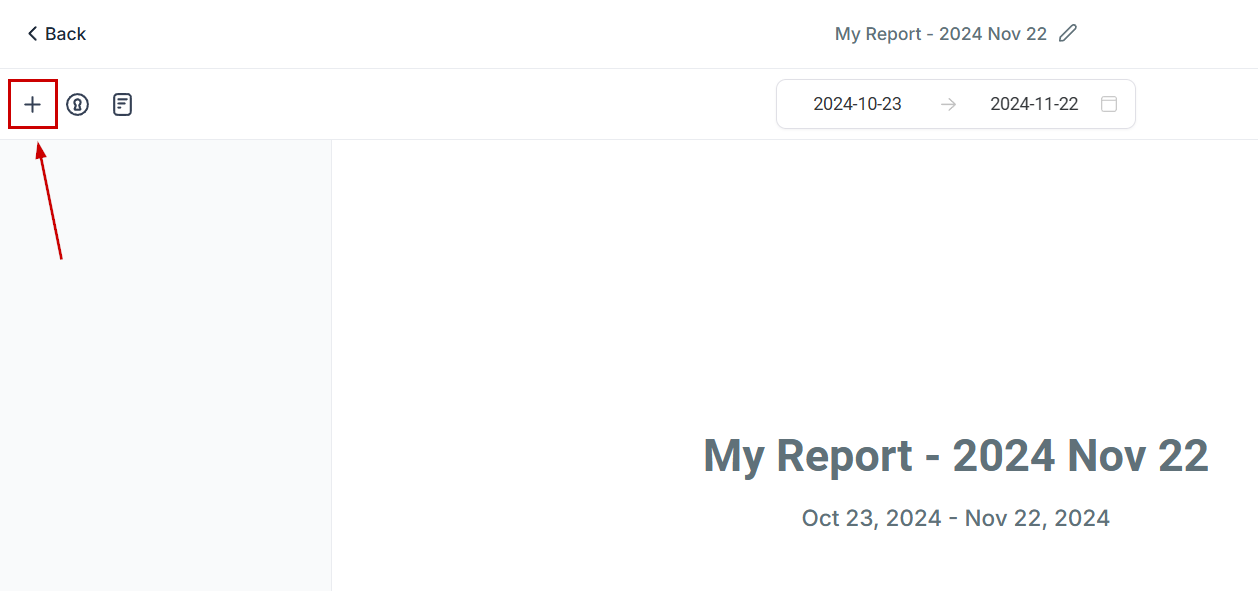
This option opens an introductory page. The rest of the content is blank so you can choose from your widgets, like with a dashboard. To add the elements click the plus sign icon at the top right corner.
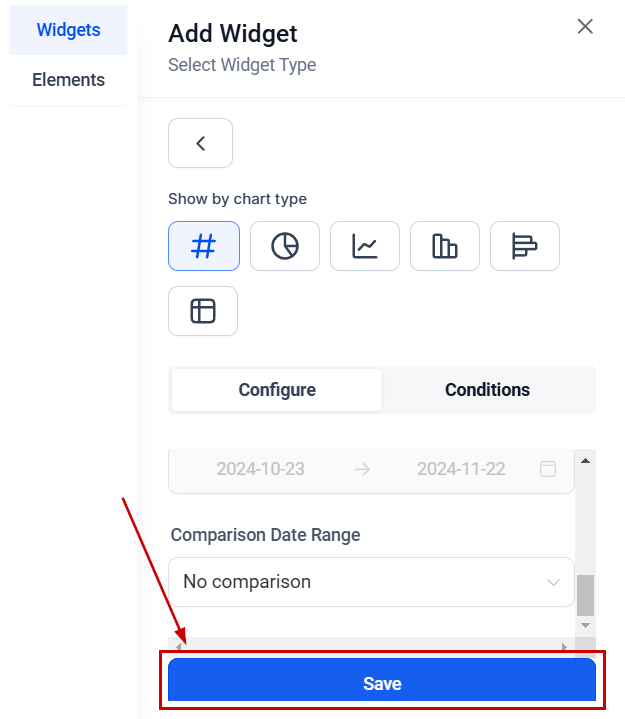
Next, select your widget or element from the menu.
Once an element is selected, head to the configure tab to set what the widget should do.
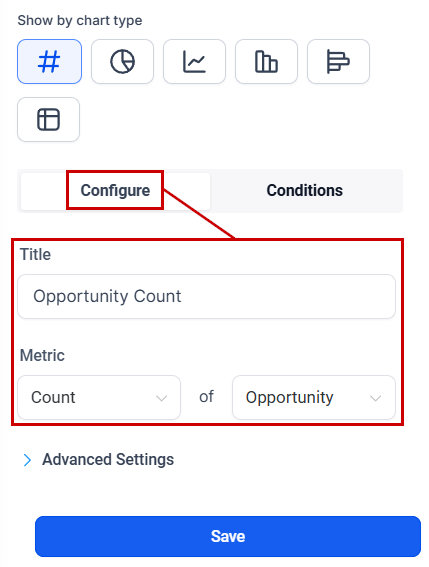
Open the advanced settings drop-down menu to set specific dates to measure the information on, or compare with.

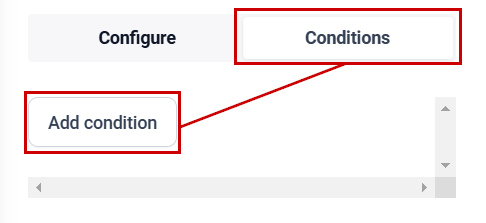
If you want to exclude some information, switch to the conditions tab to set the filters.
After setting the parameters, click save to add it to the document.
Using an Existing Dashboard
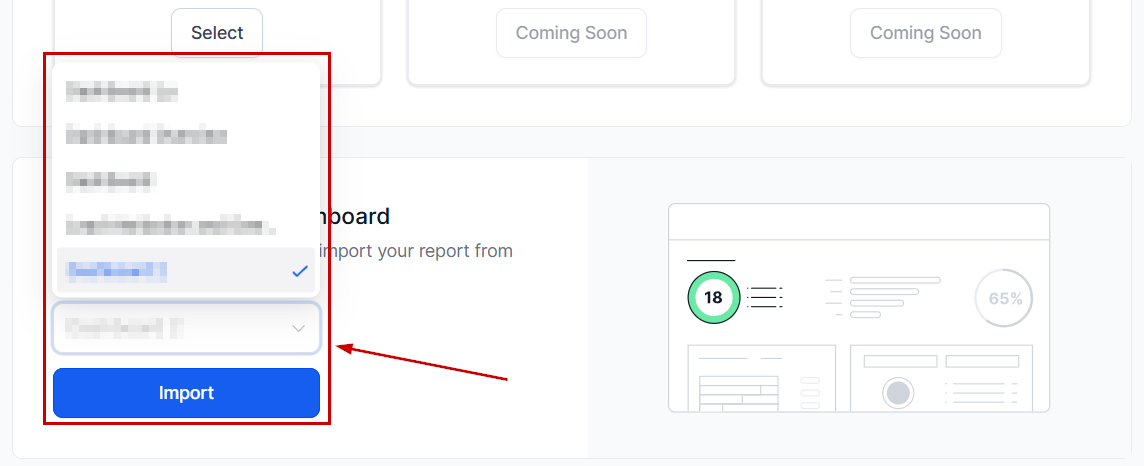
Selecting the option “Import from existing dashboard” will start your report with the widgets and elements of the dashboard inside the report. To use this option, select the dashboard you'd like to use as a base, then click Import.
Customizing The Report
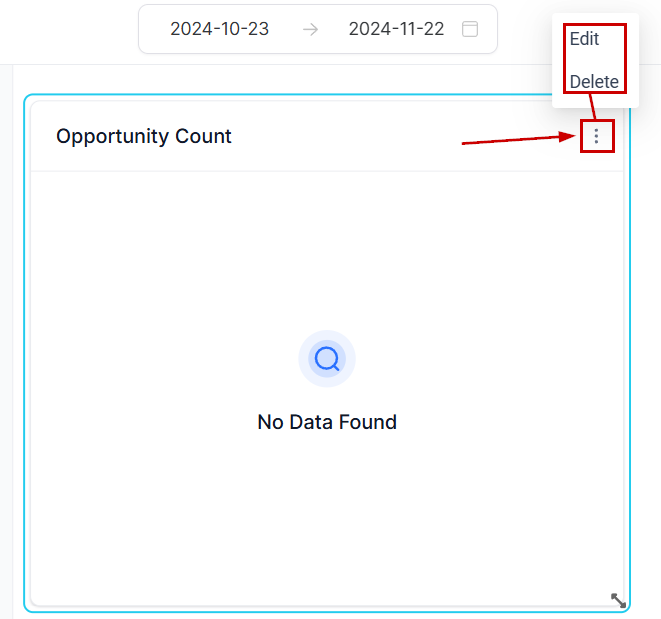
Once a widget is added, click the three-dot icon next to it to edit or delete it.
Move elements by dragging and dropping them or expand/minimize them by dragging the bottom right corner.
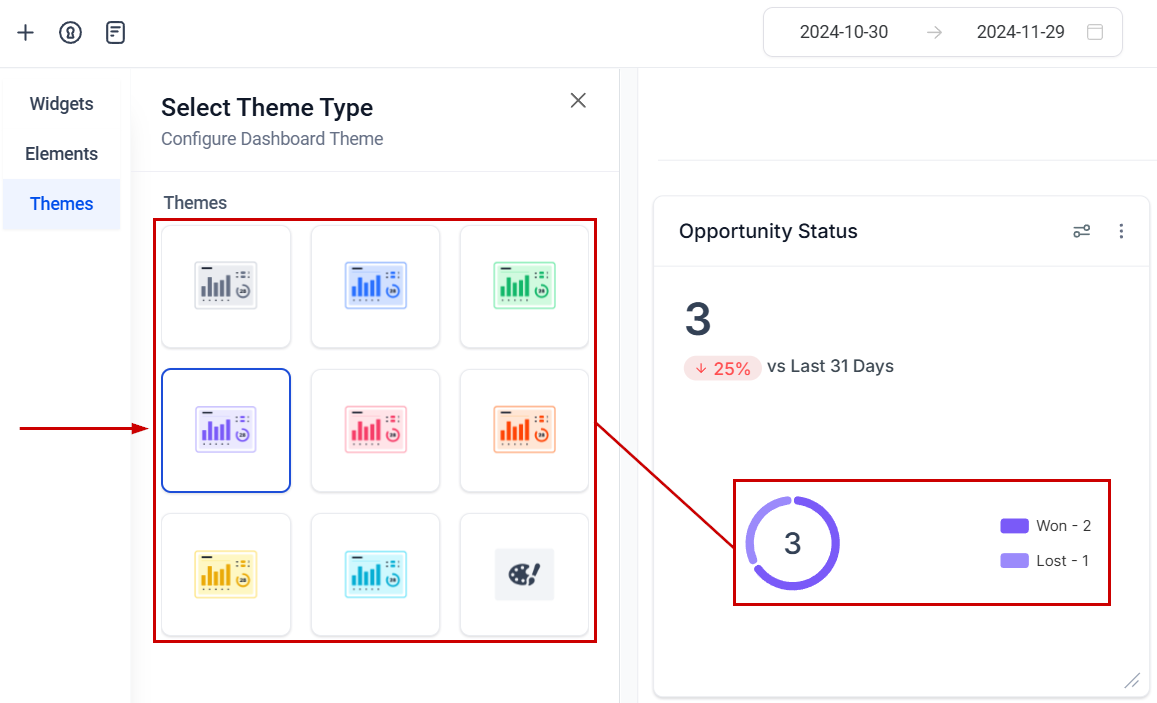
To change the colors of your Custom Report click the plus sign icon and switch to the Themes tab.
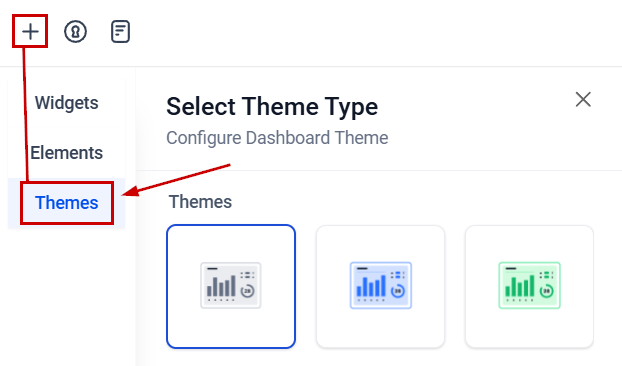
Select a predetermined theme or create your own with the Paint-Pallet Icon. We recommend reading the article “How to Configure Your Dashboard Theme,” to learn more about theme customization as the process is the same for dashboards and custom reports.
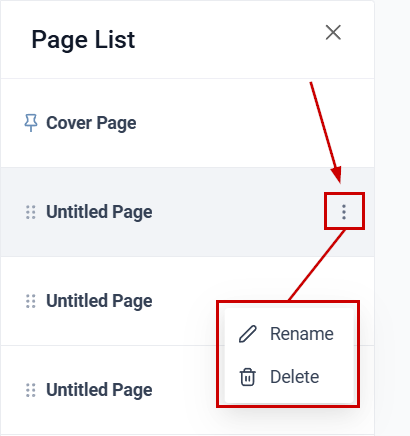
With the page list, you can reorganize or delete sections of the report. To move a page, drag it into the new position.
To rename or delete a page click the three-dot icon next to it.
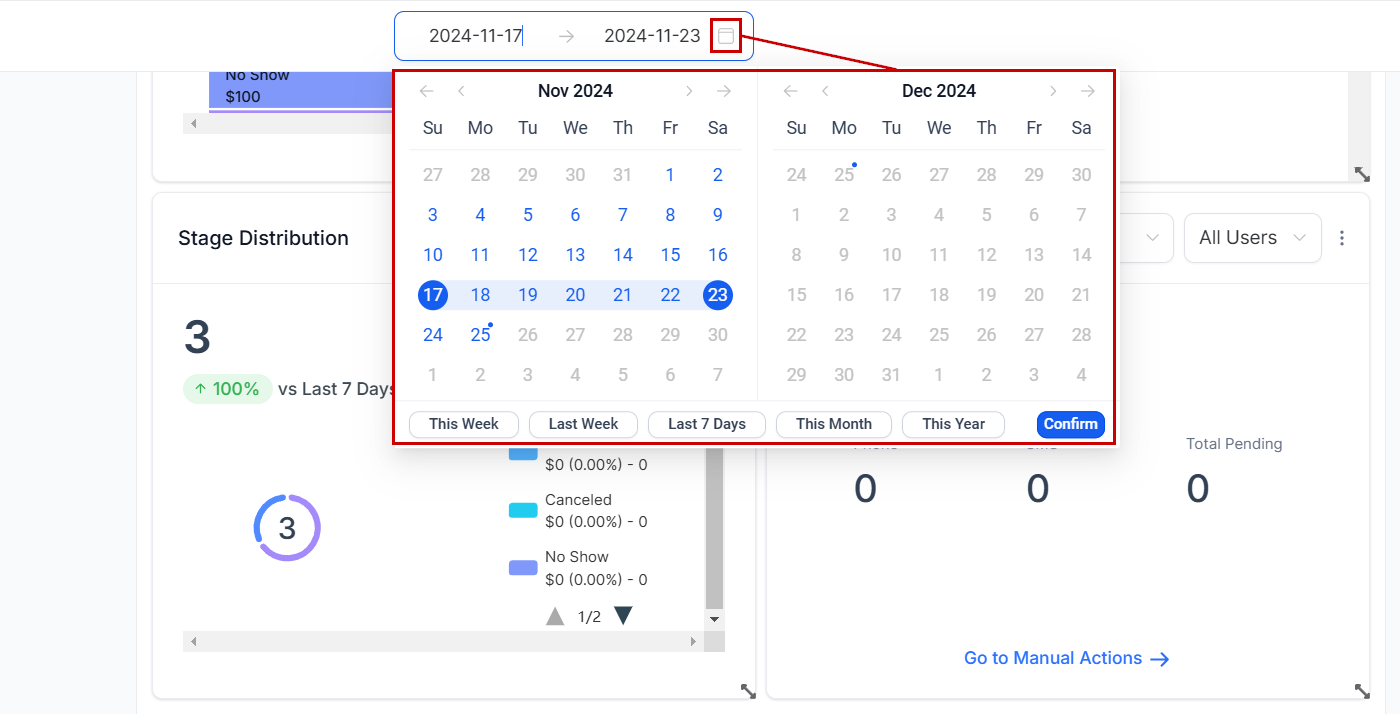
To change the date range of the displayed information, click the calendar icon. This will open a calendar so you can easily set the new beginning and ending times for the reporting.
Click the two-dot icon at the top right corner of the page to change the properties. There you can customize the logo, background color, and information displayed.
Sending the Report
Once you're satisfied with how your report looks click Send or Schedule to set the sending details.
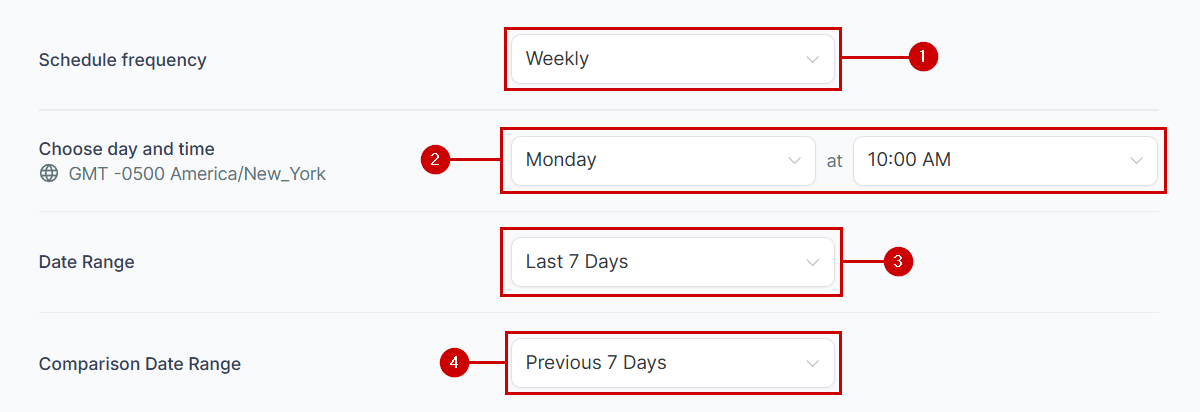
To set your schedule frequency:
- Set the repetition interval, for example weekly.
- Set the day and time you'd like the report to be sent.
- The date range will be the days the report considers for the graphs.
- Set the comparison date range to limit the days it compares the current information.
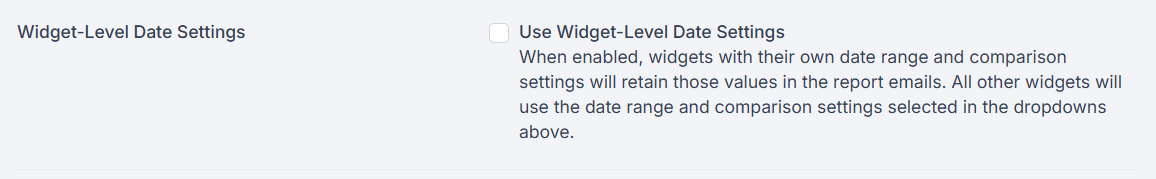
Next, enable or disable the Widget-Level Date Settings according to your preferences. If enabled, widgets with custom date ranges and comparisons will retain these settings in the emailed report. If disabled, all widgets will adhere to the global report date range selected during scheduling.
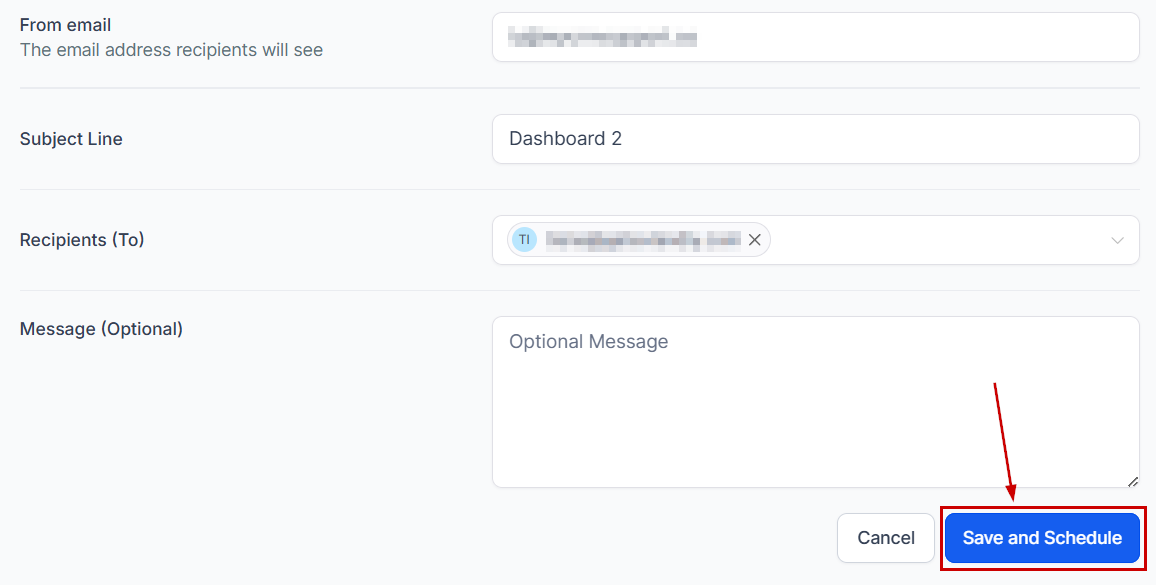
Once done, set your email details as normal, then click Save and Schedule, this will automatically generate and send a report for your added data!
Convey your business information and make informed decisions that optimize your business strategy using Custom Reports to leverage the system's data into professional and visually appealing reports.
Was this article helpful?
That’s Great!
Thank you for your feedback
Sorry! We couldn't be helpful
Thank you for your feedback
Feedback sent
We appreciate your effort and will try to fix the article