Effectively analyzing the activity of your trigger links is essential to understanding their performance and optimizing their impact. While automation takes over once a link is triggered, gaining an understanding of its success requires tracking and interpreting key data points, such as clicks and activity metrics. By closely examining these insights, you can identify which links are performing well and which may need adjustments. This guide will walk you through how to access and analyze your trigger link activity, helping you make data-driven decisions to enhance your automation strategy.
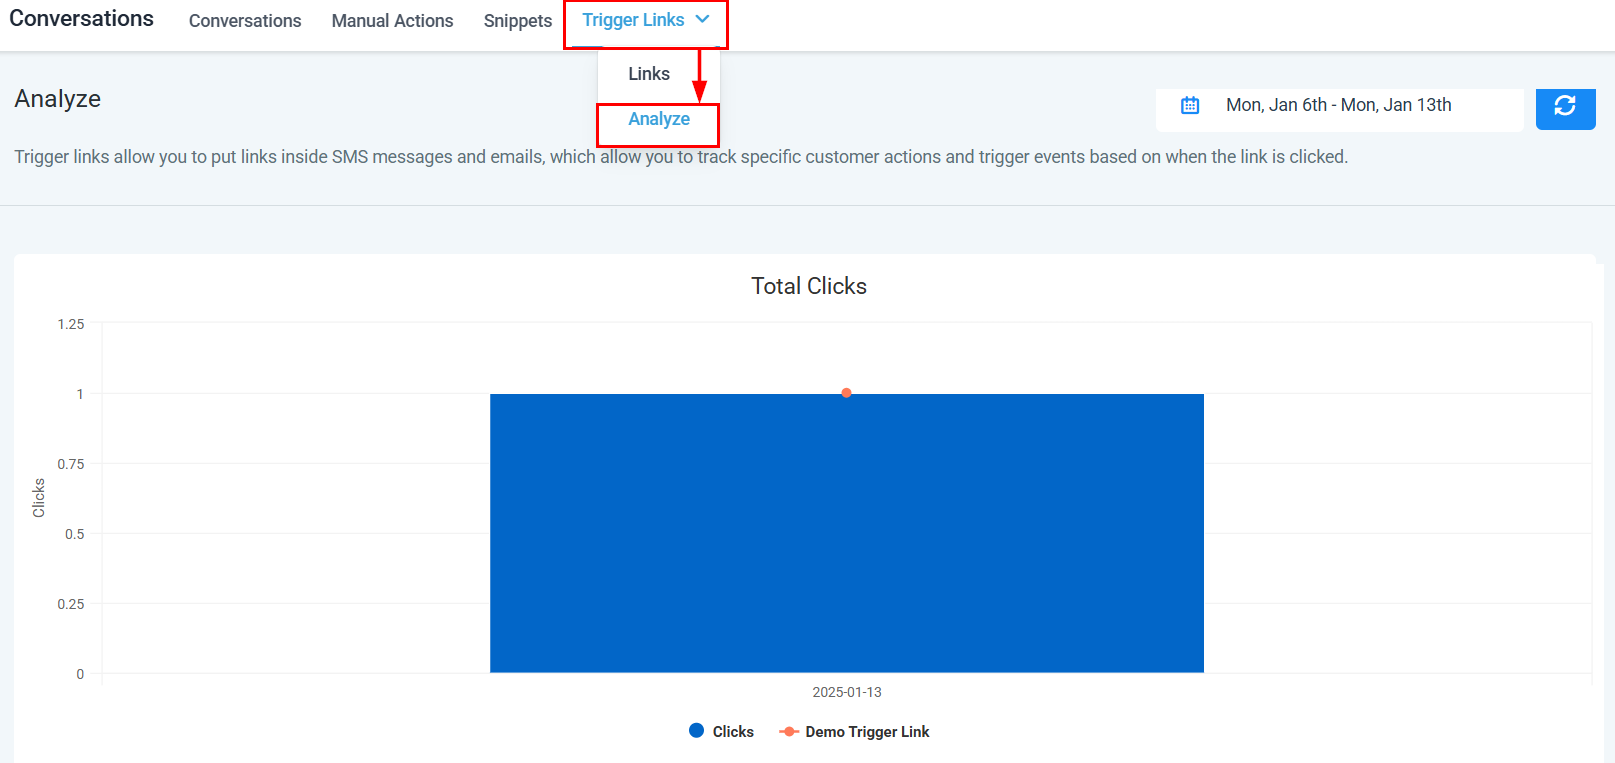
To begin your analysis, navigate to the Conversations or Marketing section in your account. Click on Trigger Links and select Analyze from the drop-down menu.
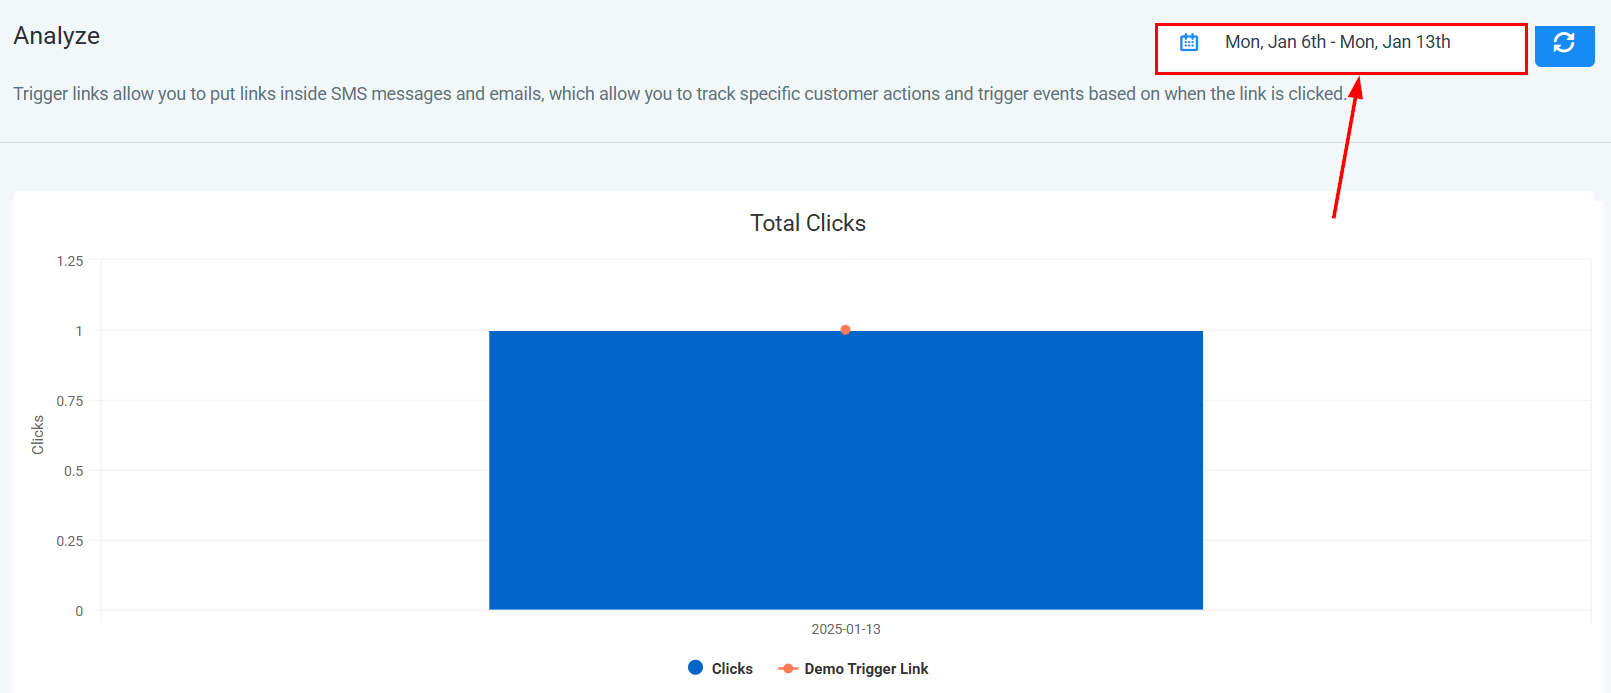
Date Range
If you wish to view data specific to a certain period, you can easily adjust the date range for your analysis. Click on the dates located on the right side of your screen. This will open a calendar popup, allowing you to select the desired range.
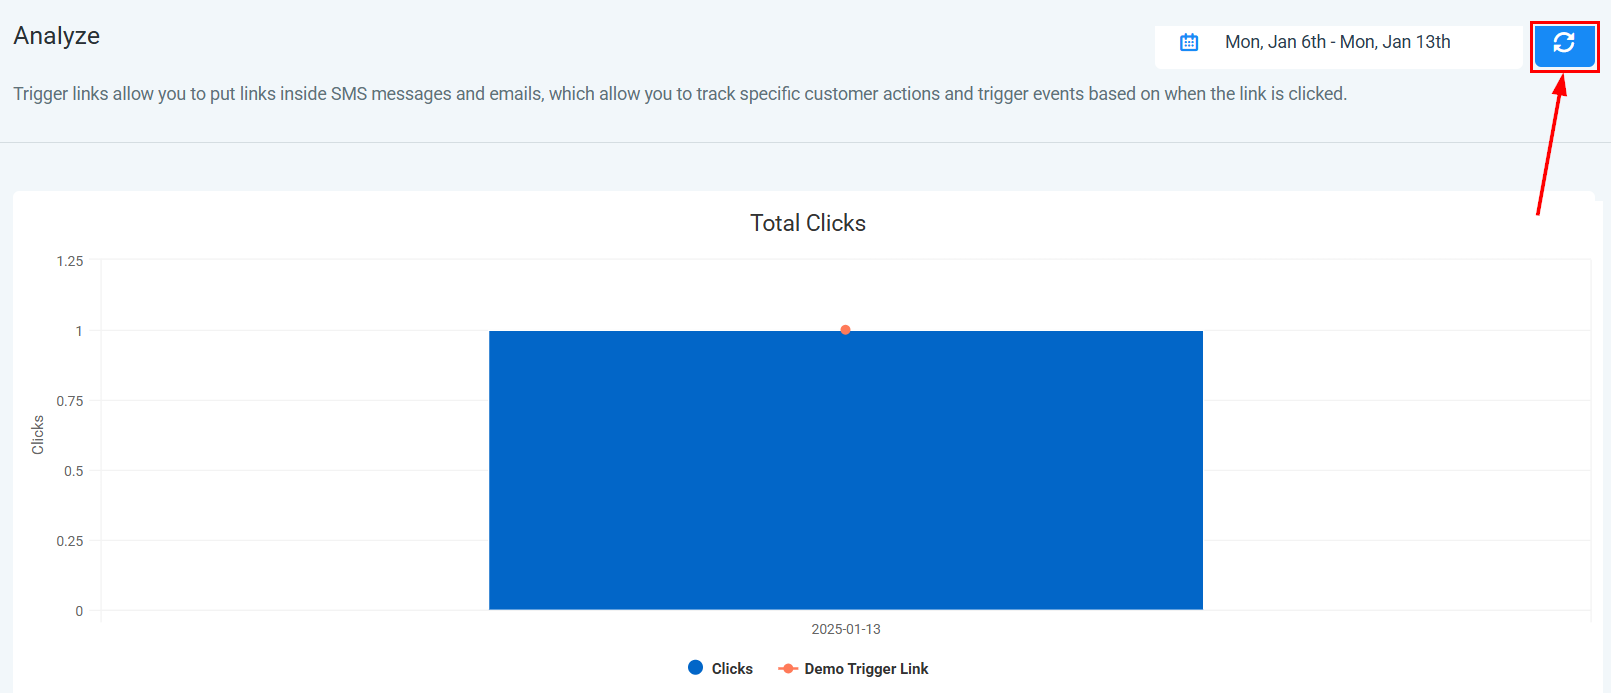
Refresh Data
Click on this icon to instantly reload the data, ensuring you have the most up-to-date information at your fingertips.
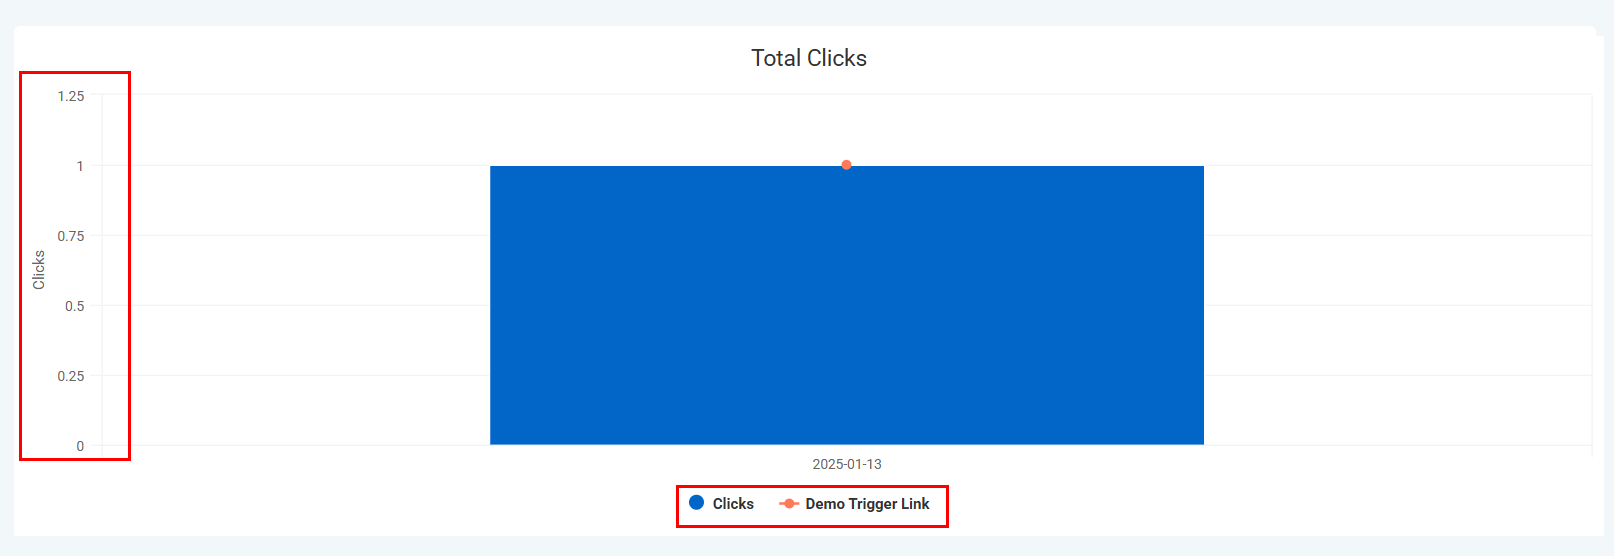
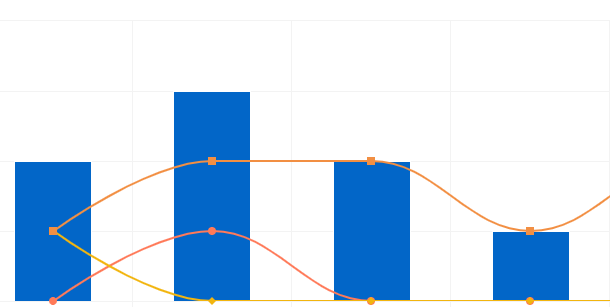
Bar Chart
The bar chart provides a visual representation of your trigger link activity.
Located on the far left side of the chart, the clicks axis indicates the total number of clicks within the specified date range. The number of clicks will vary based on the performance of the most popular links.
Identifying Trigger Links
While analyzing trigger links, several data points are crucial for in-depth analysis. A bar chart visually demonstrates the progression of each link over time, with different colors and shapes indicating performance changes. Observing these patterns can offer valuable insights into trends and anomalies.
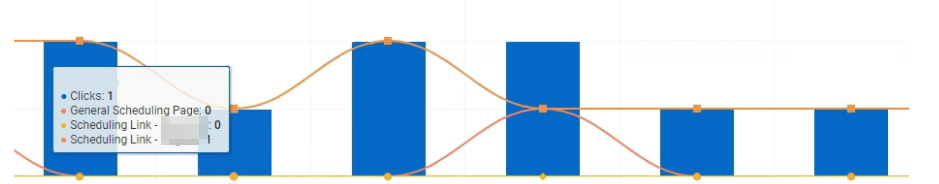
Hover Effect
Hover over any bar in the chart to view additional details. This will display the total number of clicks associated with the trigger link during the specific period, saving you valuable time.
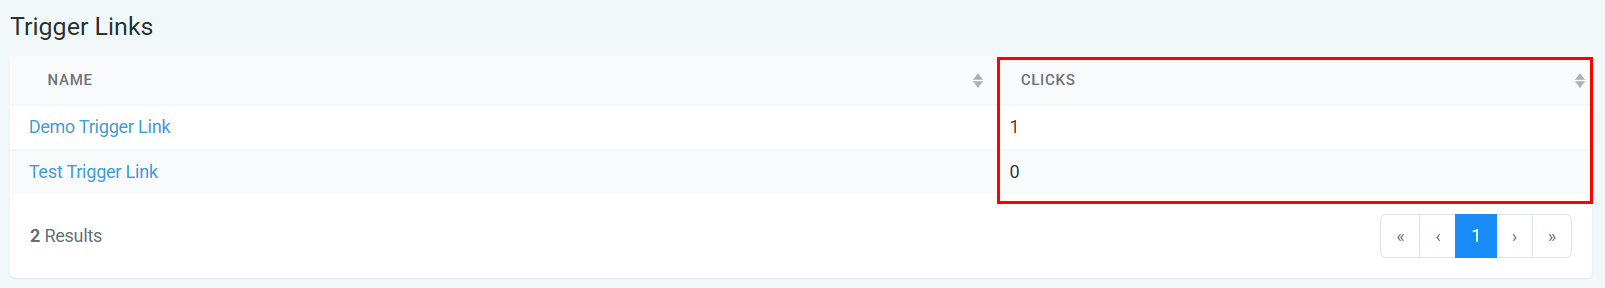
Data Table
The data table presents a detailed overview of your trigger links, organized for easy navigation.
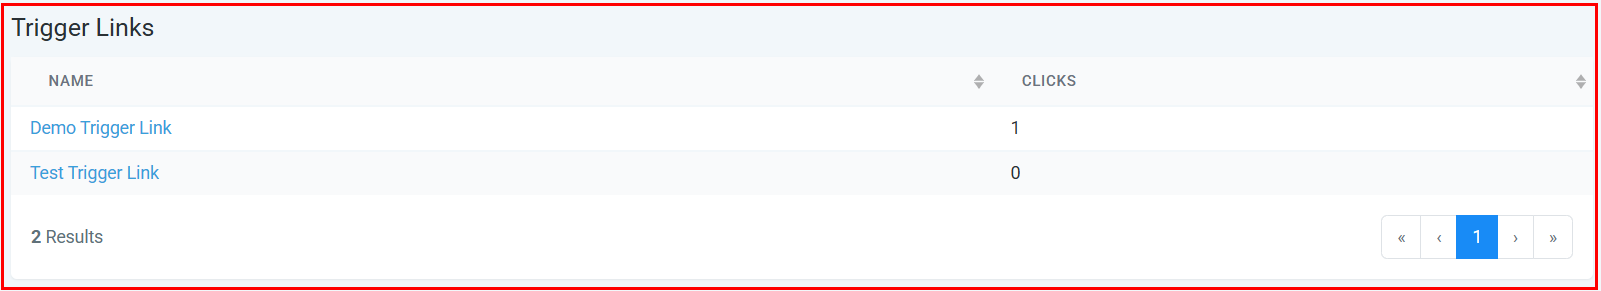
Name
The left column displays the name of each trigger link, arranged alphabetically for quick reference.
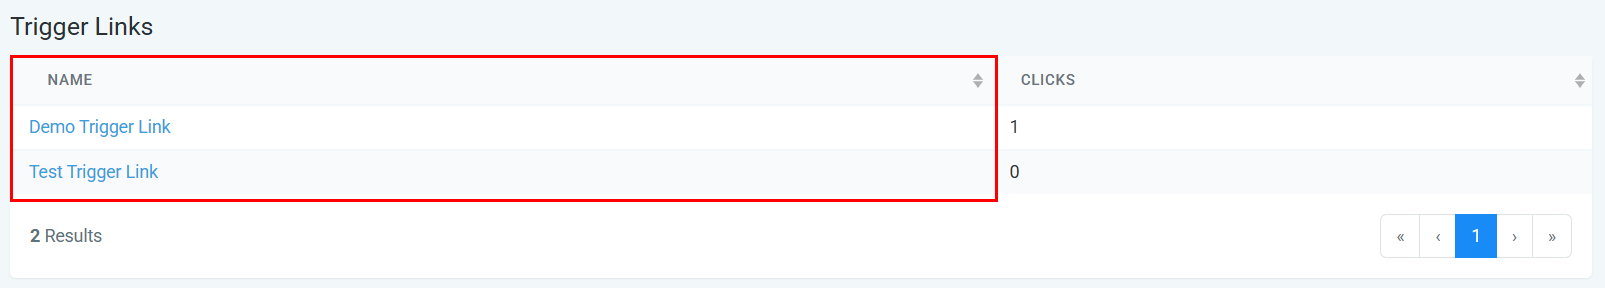
Clicks
The right column shows the total number of clicks for each trigger link.
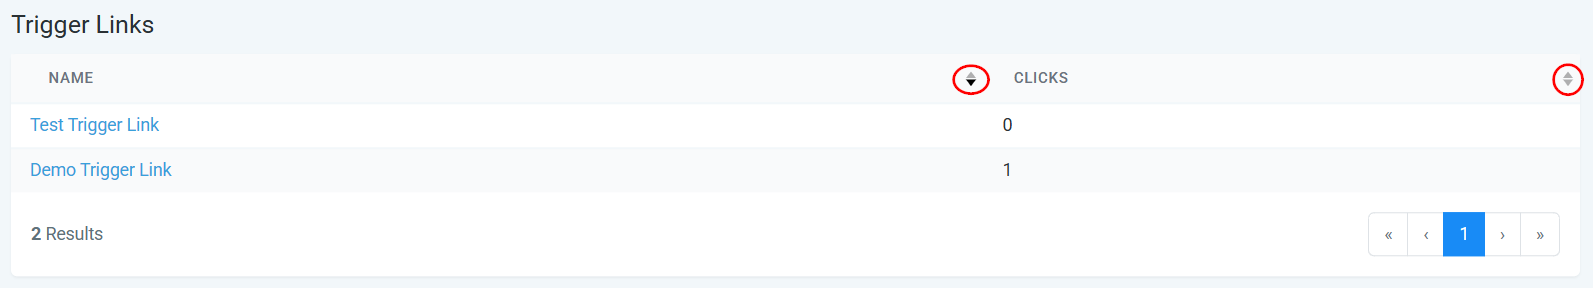
Sort either column in ascending or descending order by clicking the arrow icons next to the header, making it simple to organize your links.
By tracking key metrics, and using the tools provided to customize your analysis, you can gain actionable insights that help you fine-tune your strategy. Whether you are examining trends over time or reviewing specific links, this process ensures you have the data necessary to improve your campaign performance and achieve greater success.
Was this article helpful?
That’s Great!
Thank you for your feedback
Sorry! We couldn't be helpful
Thank you for your feedback
Feedback sent
We appreciate your effort and will try to fix the article